GeoGebra Lab 3
In this lab you will explore some of the graphing and measurement features of GeoGebra for segments and angles. Answer all questions in a text box in your GeoGebra file. Create a text box using the tool that says ABC located under the slider icon (pictured at right). Click where you would like the box to be.
- If the coordinate axes do not appear in the Graphics View, follow the instructions from Lab #1 to turn on the axes. Currently the x and y axes are in a 1:1 ratio, meaning that the scales are equal.
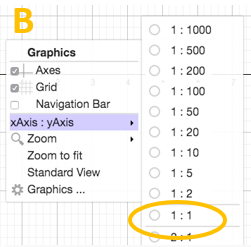
Press and hold down the shift key and click on the y axis simultaneously. A label will appear stating the scale “x:y = 1:1”. Now drag the y axis up and down. What happens to that scale definition? To return the scale definition to 1:1 you can simply right click on the Graphics window and a menu will appear as shown in image B. Choose x axis: y axis -> 1:1.

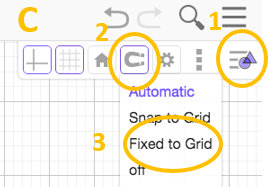
Now, hit the Select button (tool with the arrow icon). Then enter the Graphics View options. Select the magnet icon, then choose ‘Fixed to Grid’. (see image C). This allows drawn points to snap to lattice points, points with integer coordinates.

- With your cursor, click on the Input Command Line and simply type \((4, 5)\) and press enter. The point \((4, 5)\) should be plotted and labeled A. If you cannot see the point, you can zoom in or out using your mouse wheel, or two-finger click and drag the background so that you can see the point.
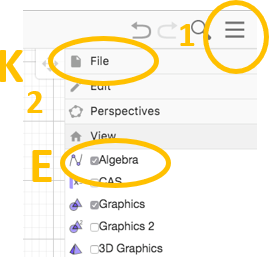
- Plot the points \((7, 3)\) and \((1, 0)\) in the same way. GeoGebra automatically labels in alphabetical order and keeps a record of your objects in the Algebra View to the left. See picture below, at Label E.
- Select the Move tool and move the Graphics View down so that the first quadrant is in full view in the window.
- Press and hold down the shift key and select the y axis (as described in part B). What happens to points A, B and C? Is this what you expected? Do the coordinates of A, B and C change?
- Construct \(\Delta ABC\) using the polygon tool.
- What type of triangle does \(\Delta ABC\) appear to be? Measure the angles of \(\Delta ABC\) using the Angle tool. Select the three points in a clockwise order with the vertex of the angle to be measured as the second point.
- What information is provided in the Algebra View at this time?
If you would like to save your work, see image K. The area circled and labeled “1” gives a menu that includes an option to save your work as a GeoGebra (.ggb) file.
